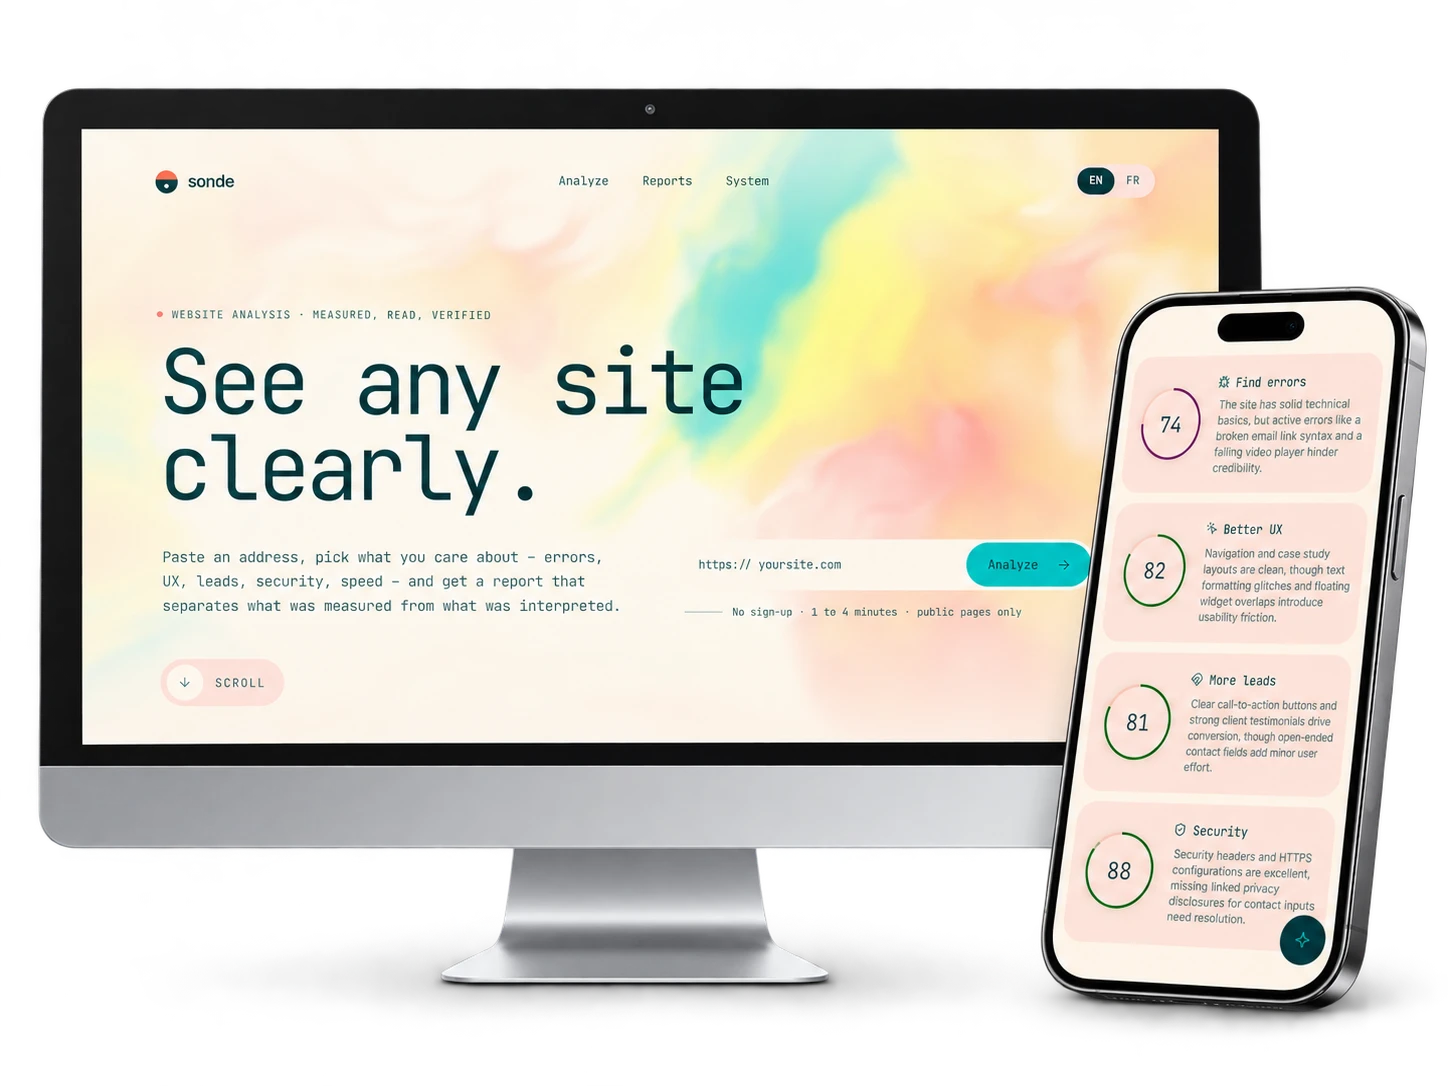
Sonde is a website analysis tool: you paste an address, choose what matters and get a report that separates what is measured from what is interpreted. I wanted it to be trustworthy: every claim says whether it is measured, observed, interpreted by the AI or a hypothesis.
Brief and goal
Analyze any public site against the chosen goals (errors, UX, leads, security, speed, accessibility, SEO…) and deliver a report where every claim states its source.
Role and responsibilities
Personal project: designing the tool, architecture, visual direction, programming with Claude Code, testing on real sites and deployment on Firebase.
Credits
Personal project. The tool’s design, the visual direction and the programming with Claude Code are my work.
Use of AI
I used Claude Code to program, test, debug and deploy Sonde, then to add this sheet to the portfolio, and the Gemini API inside the tool to read sites, write findings and answer questions. My personal contribution includes the idea of the tool, the instructions, the visual direction, the interaction choices, reviewing the reports and validation.
Production steps
-
Step 1: Building the architecture
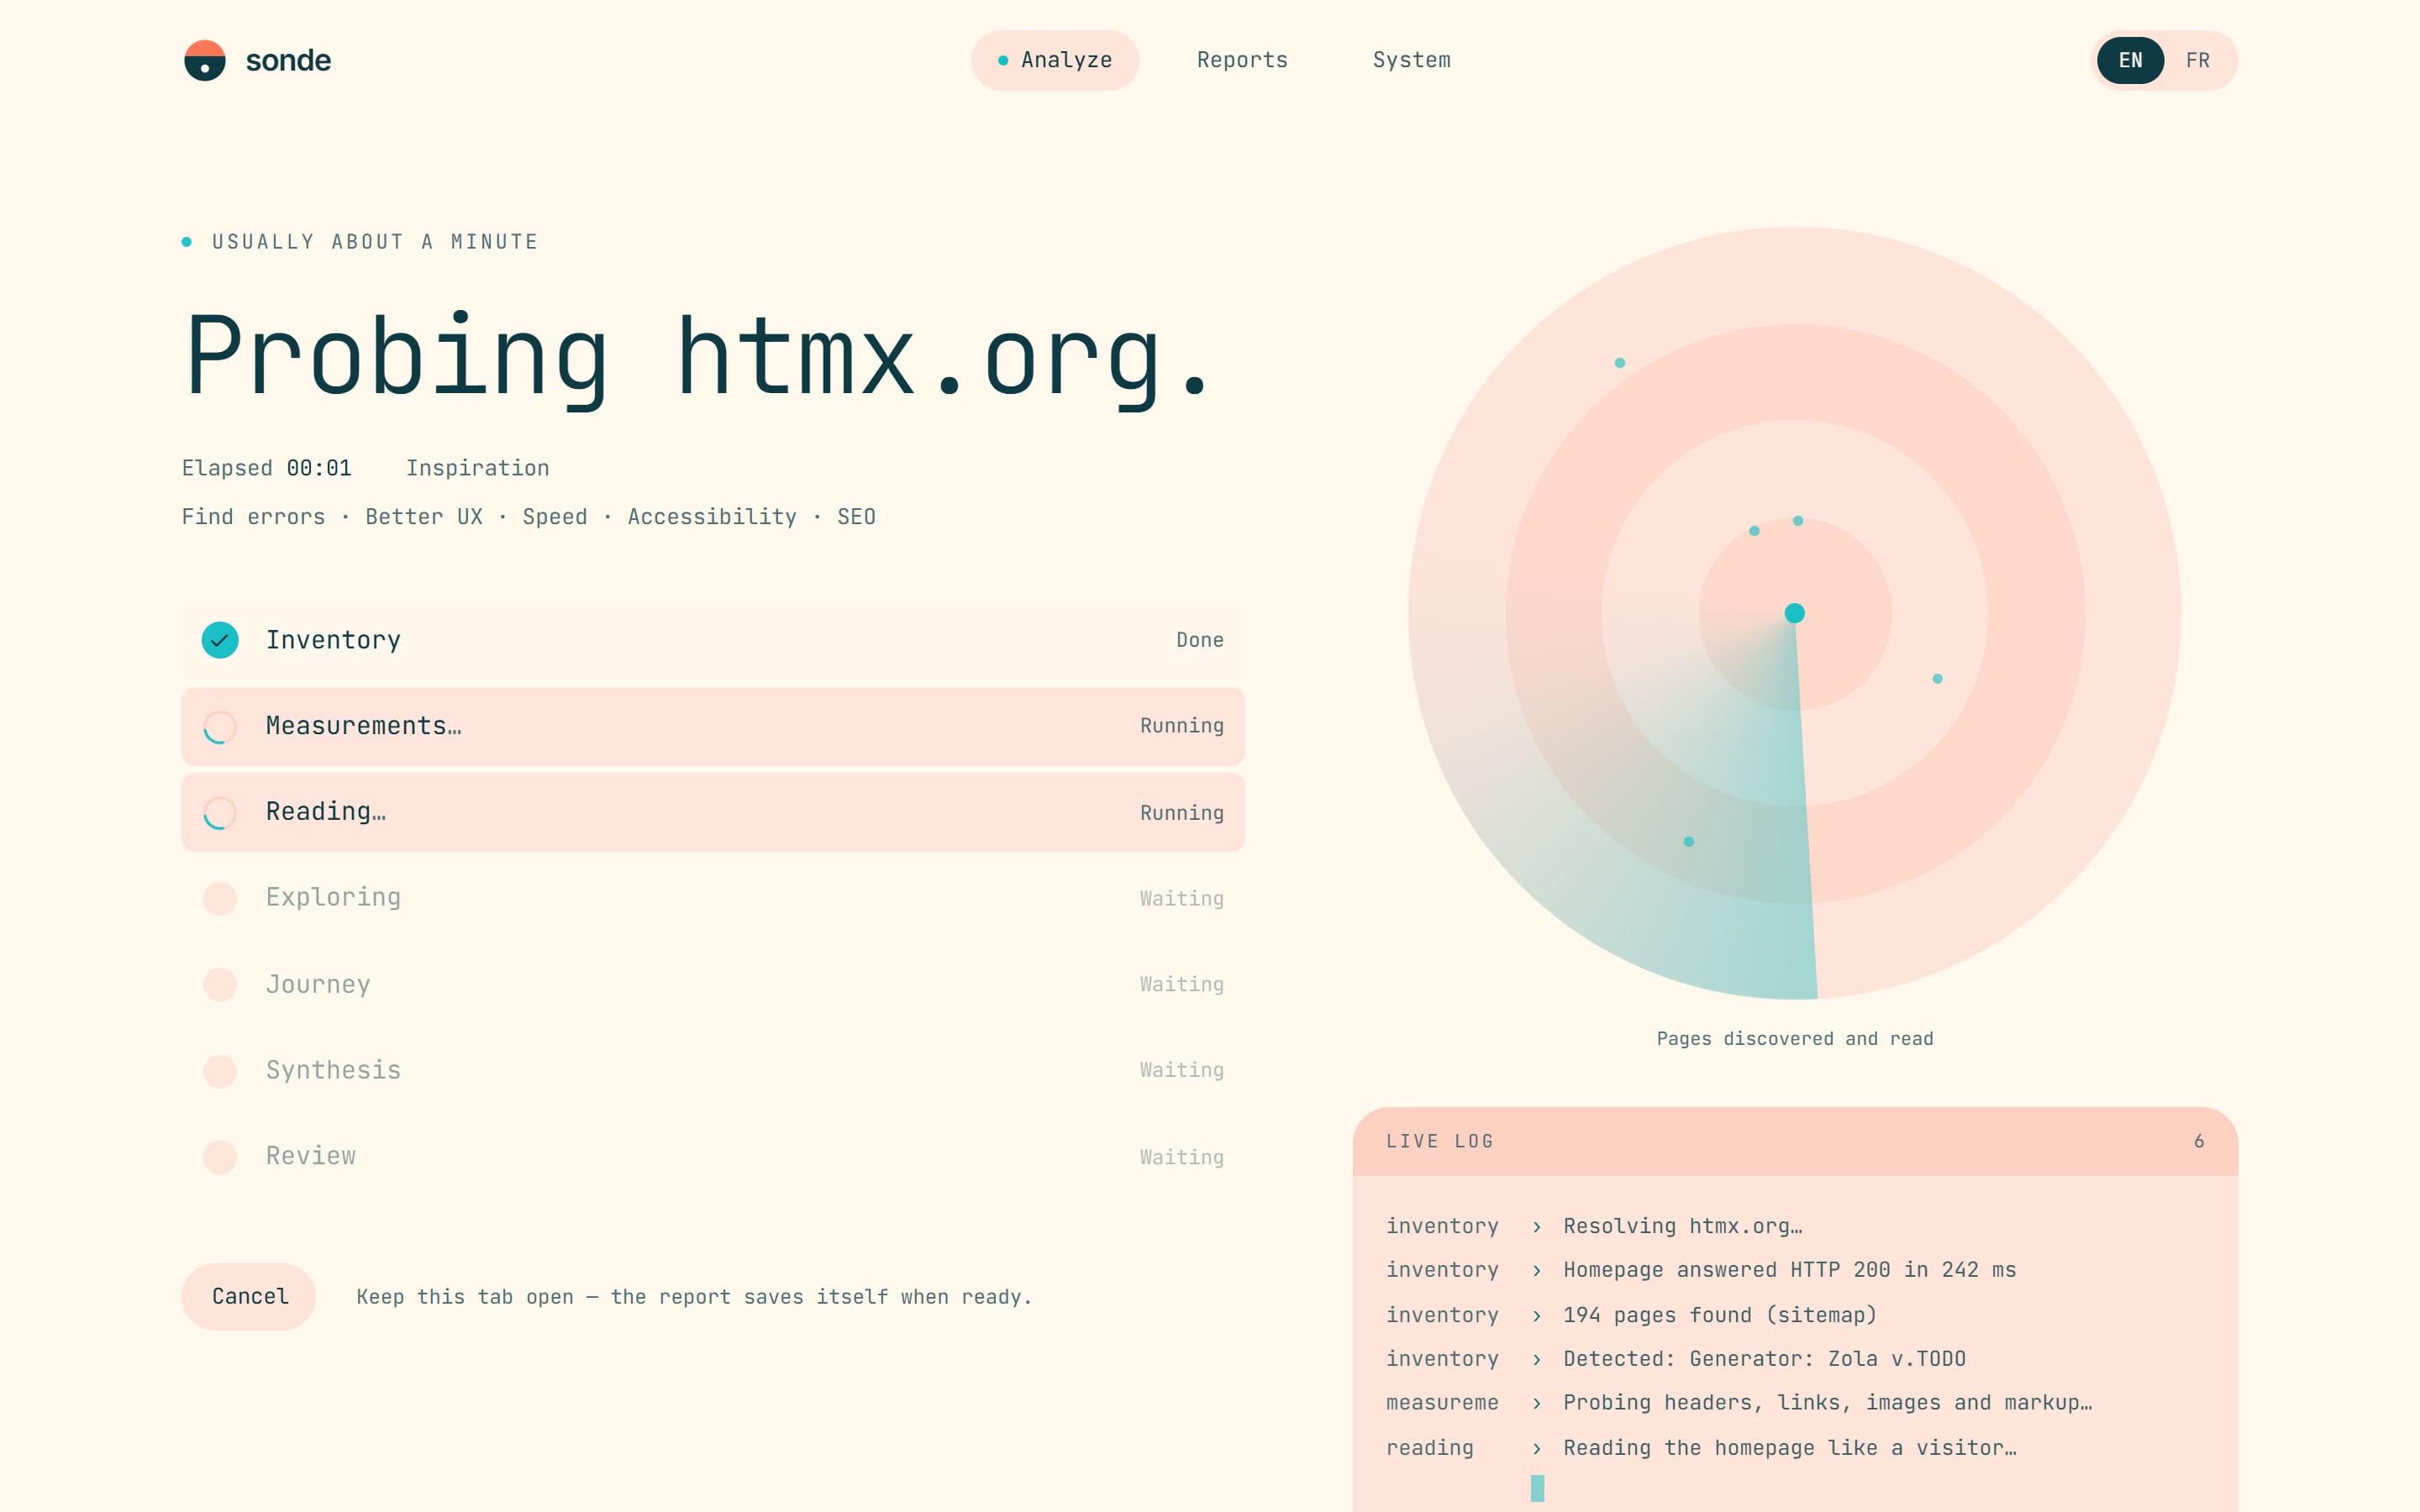
I defined the architecture with Claude Code: a React interface in TypeScript on Firebase and a single cloud function that runs the analysis and shows its progress live. The Gemini API key stays in Google’s Secret Manager, never in the browser. From the start, every claim in the report had to state its source.
-
Step 2: Measuring before interpreting
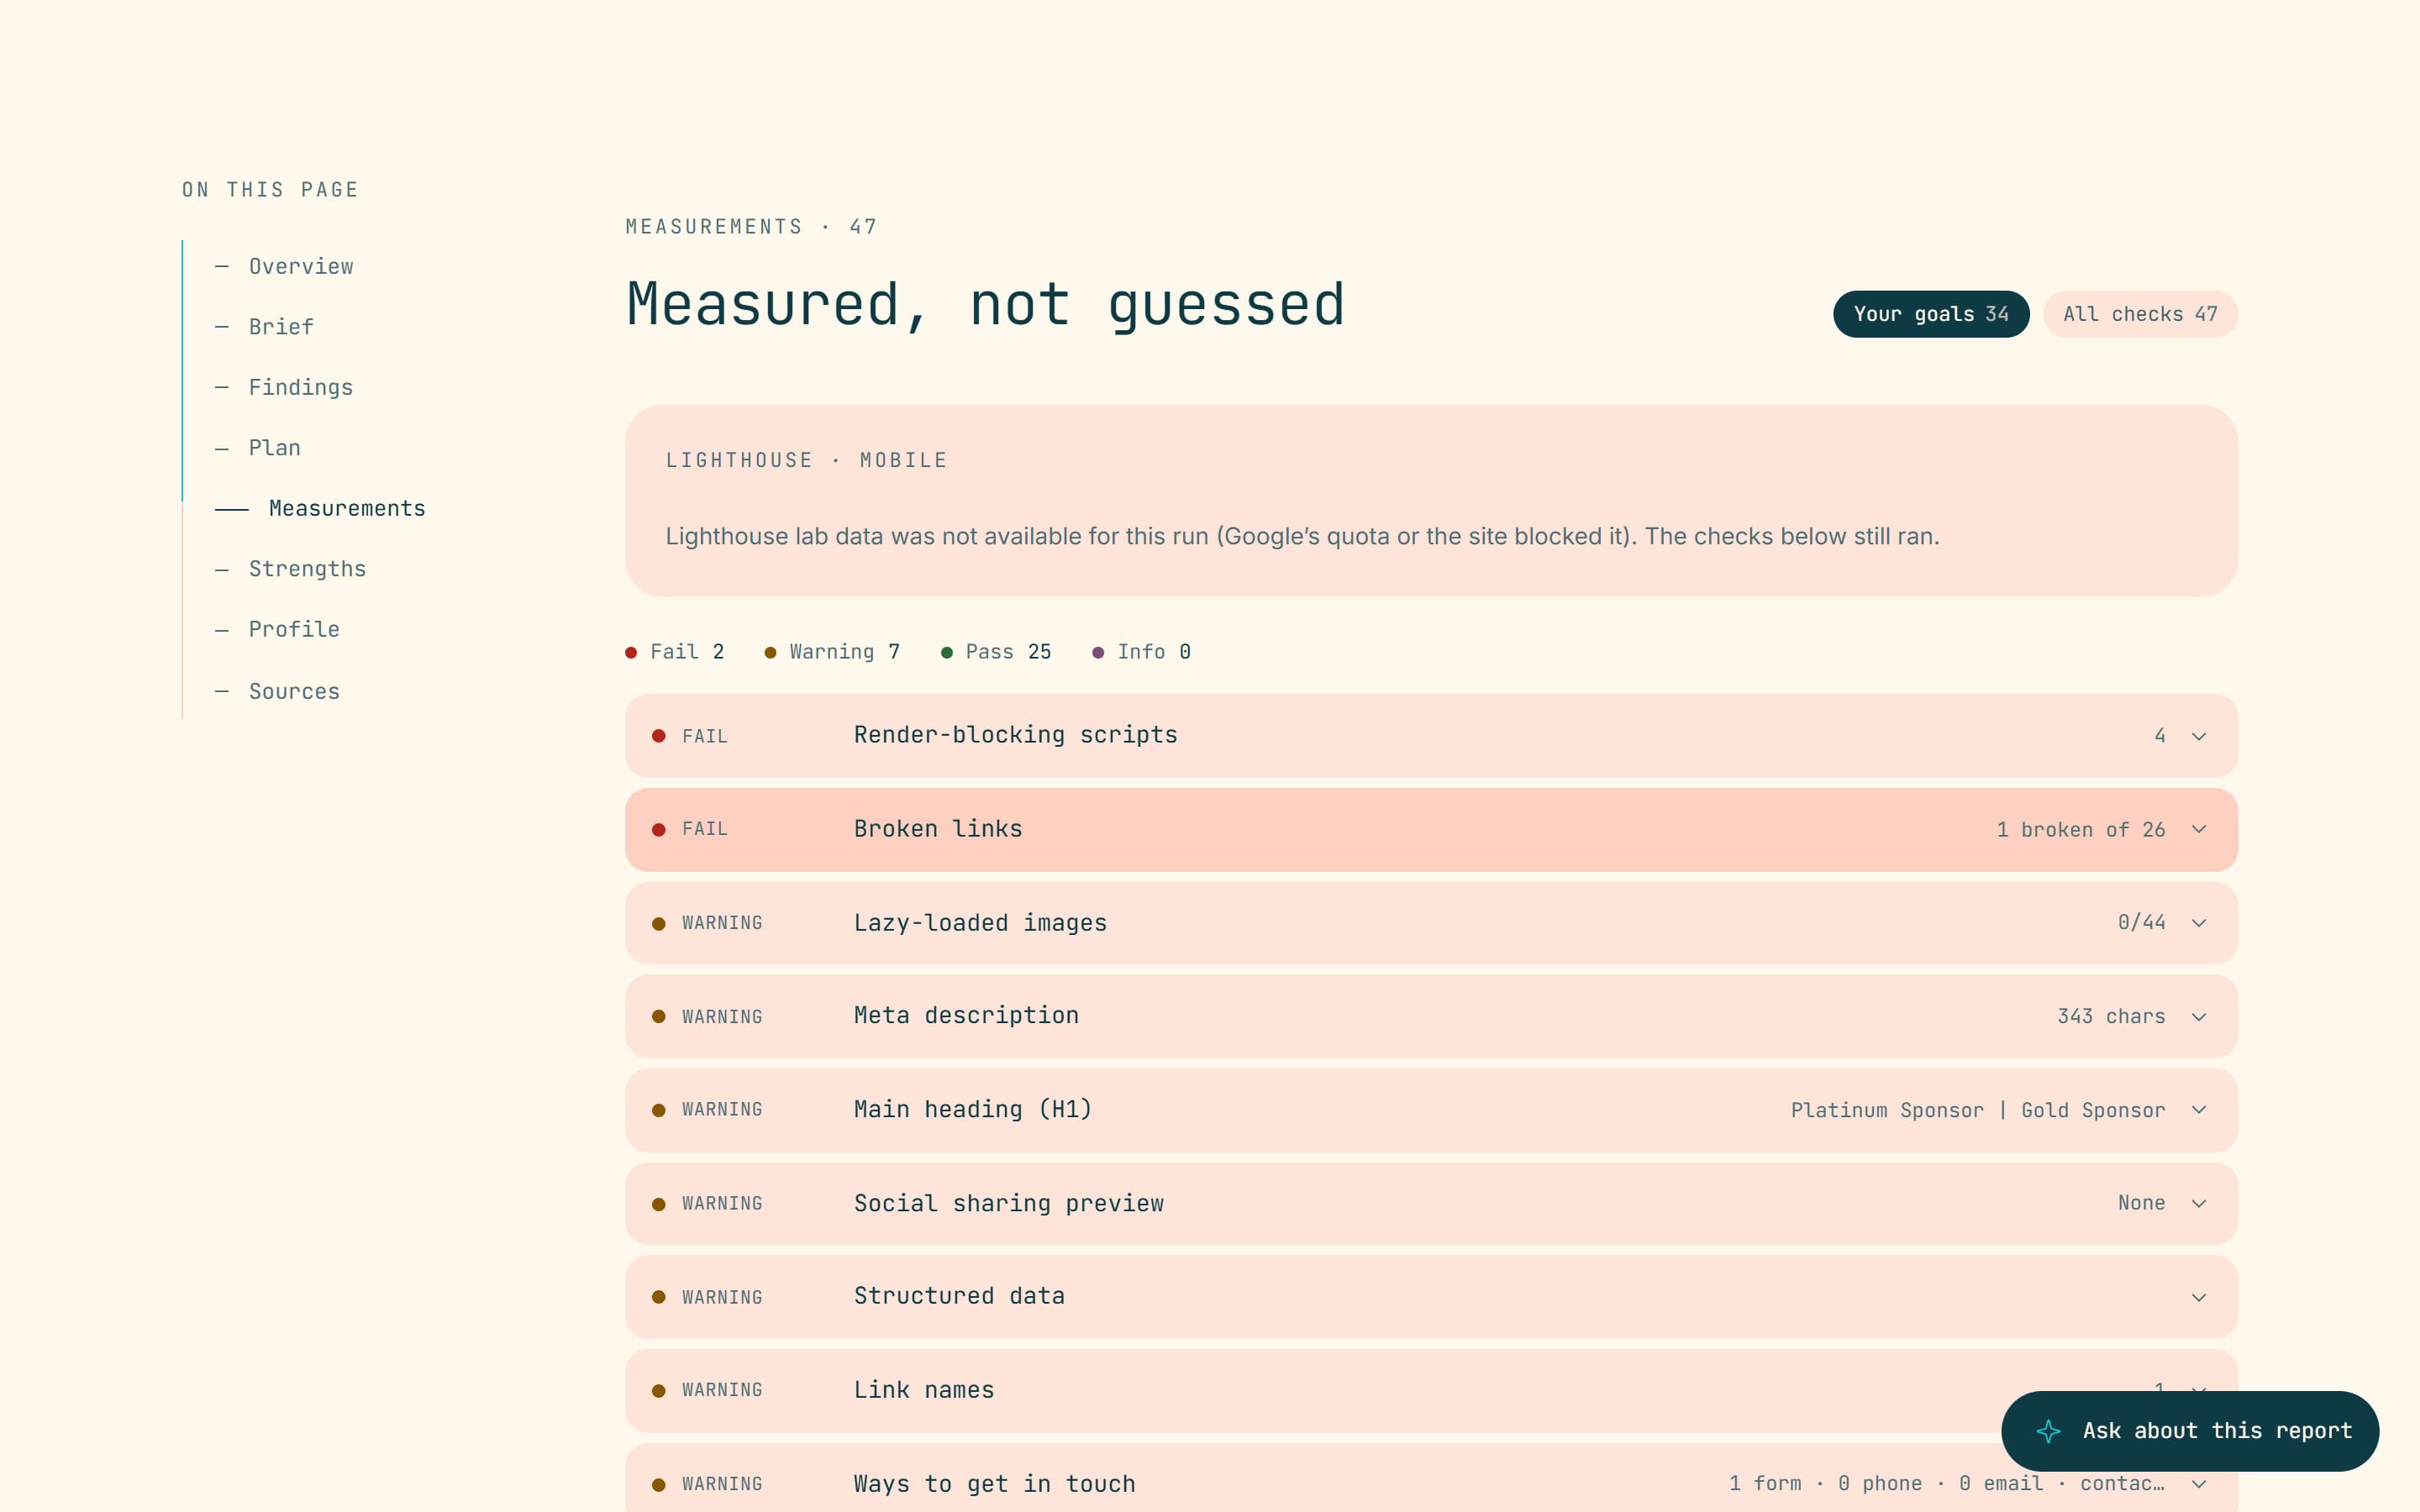
First, Sonde takes inventory of the site and runs about 45 checks without AI: HTTPS, security headers, broken links, alt text, forms and more. Gemini then reads the pages and writes the findings; in an in-depth analysis, it also retraces a visitor’s journey. Finally, a review pass removes anything the evidence does not support.
-
Step 3: First design
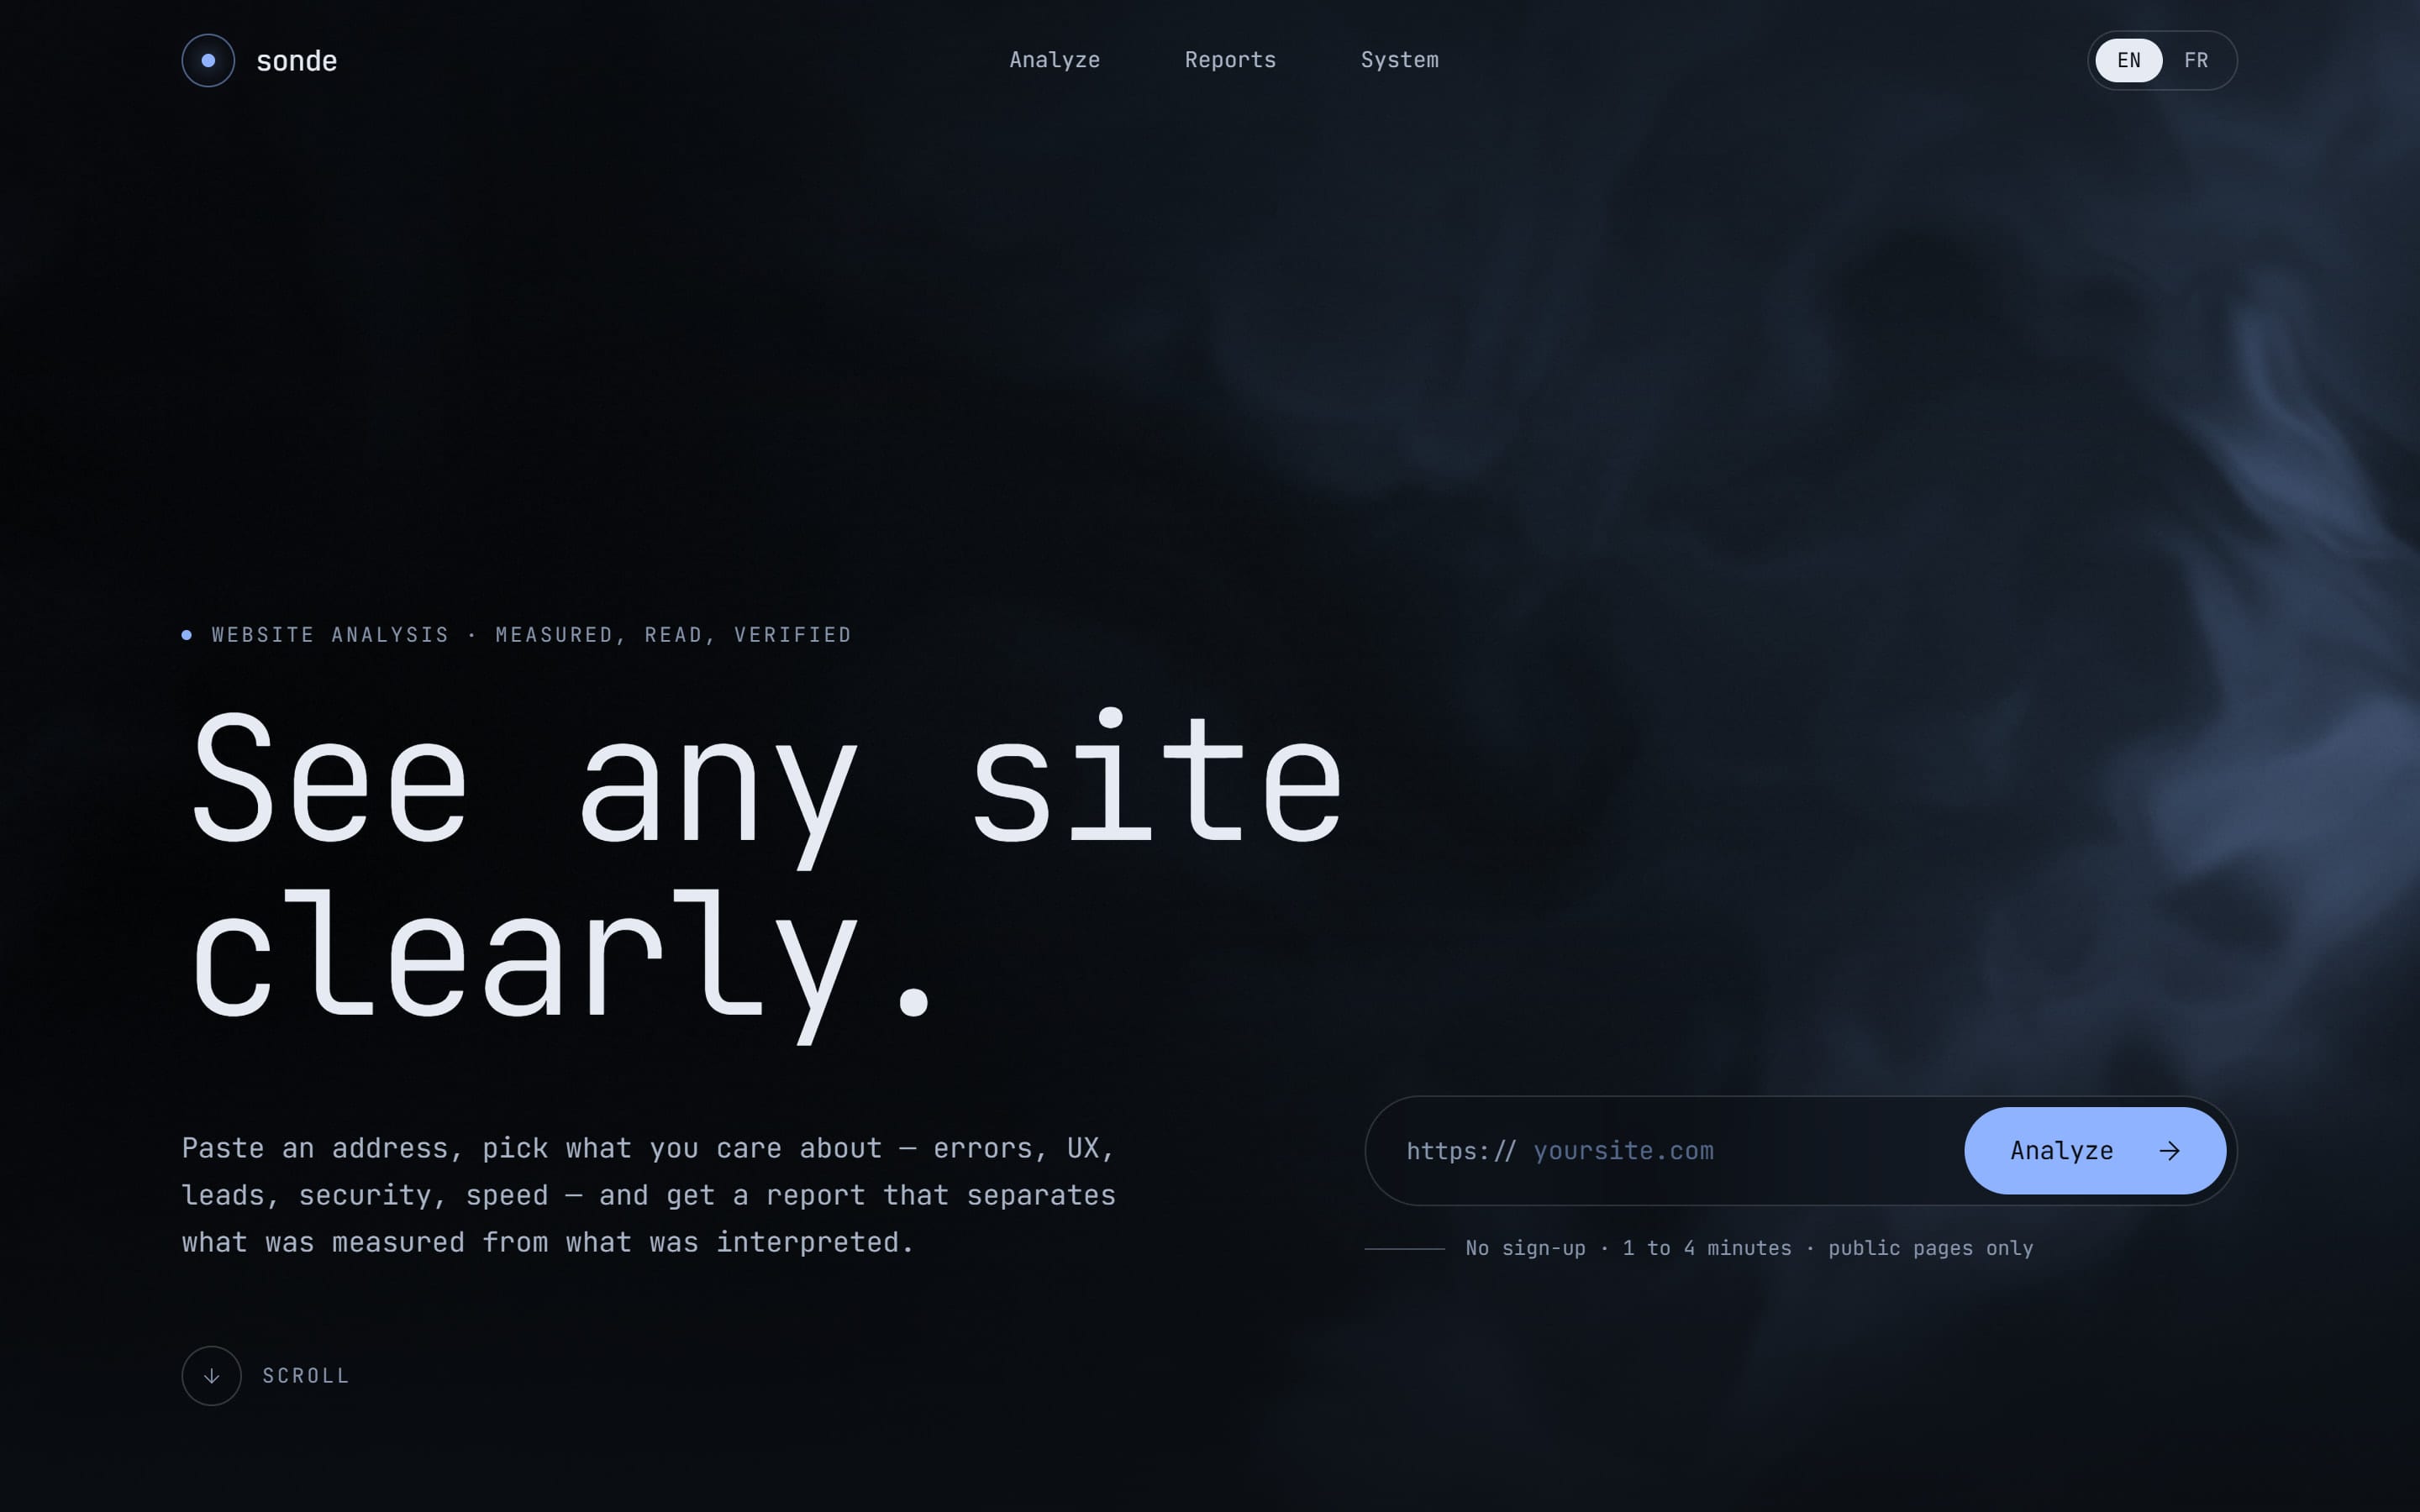
I first designed a night-time interface from a mood board: midnight blue, light monospace type, a WebGL silk behind the title and a planet rising under the call to action. The animations are custom-made, without an animation library.
-
Step 4: Testing on real sites
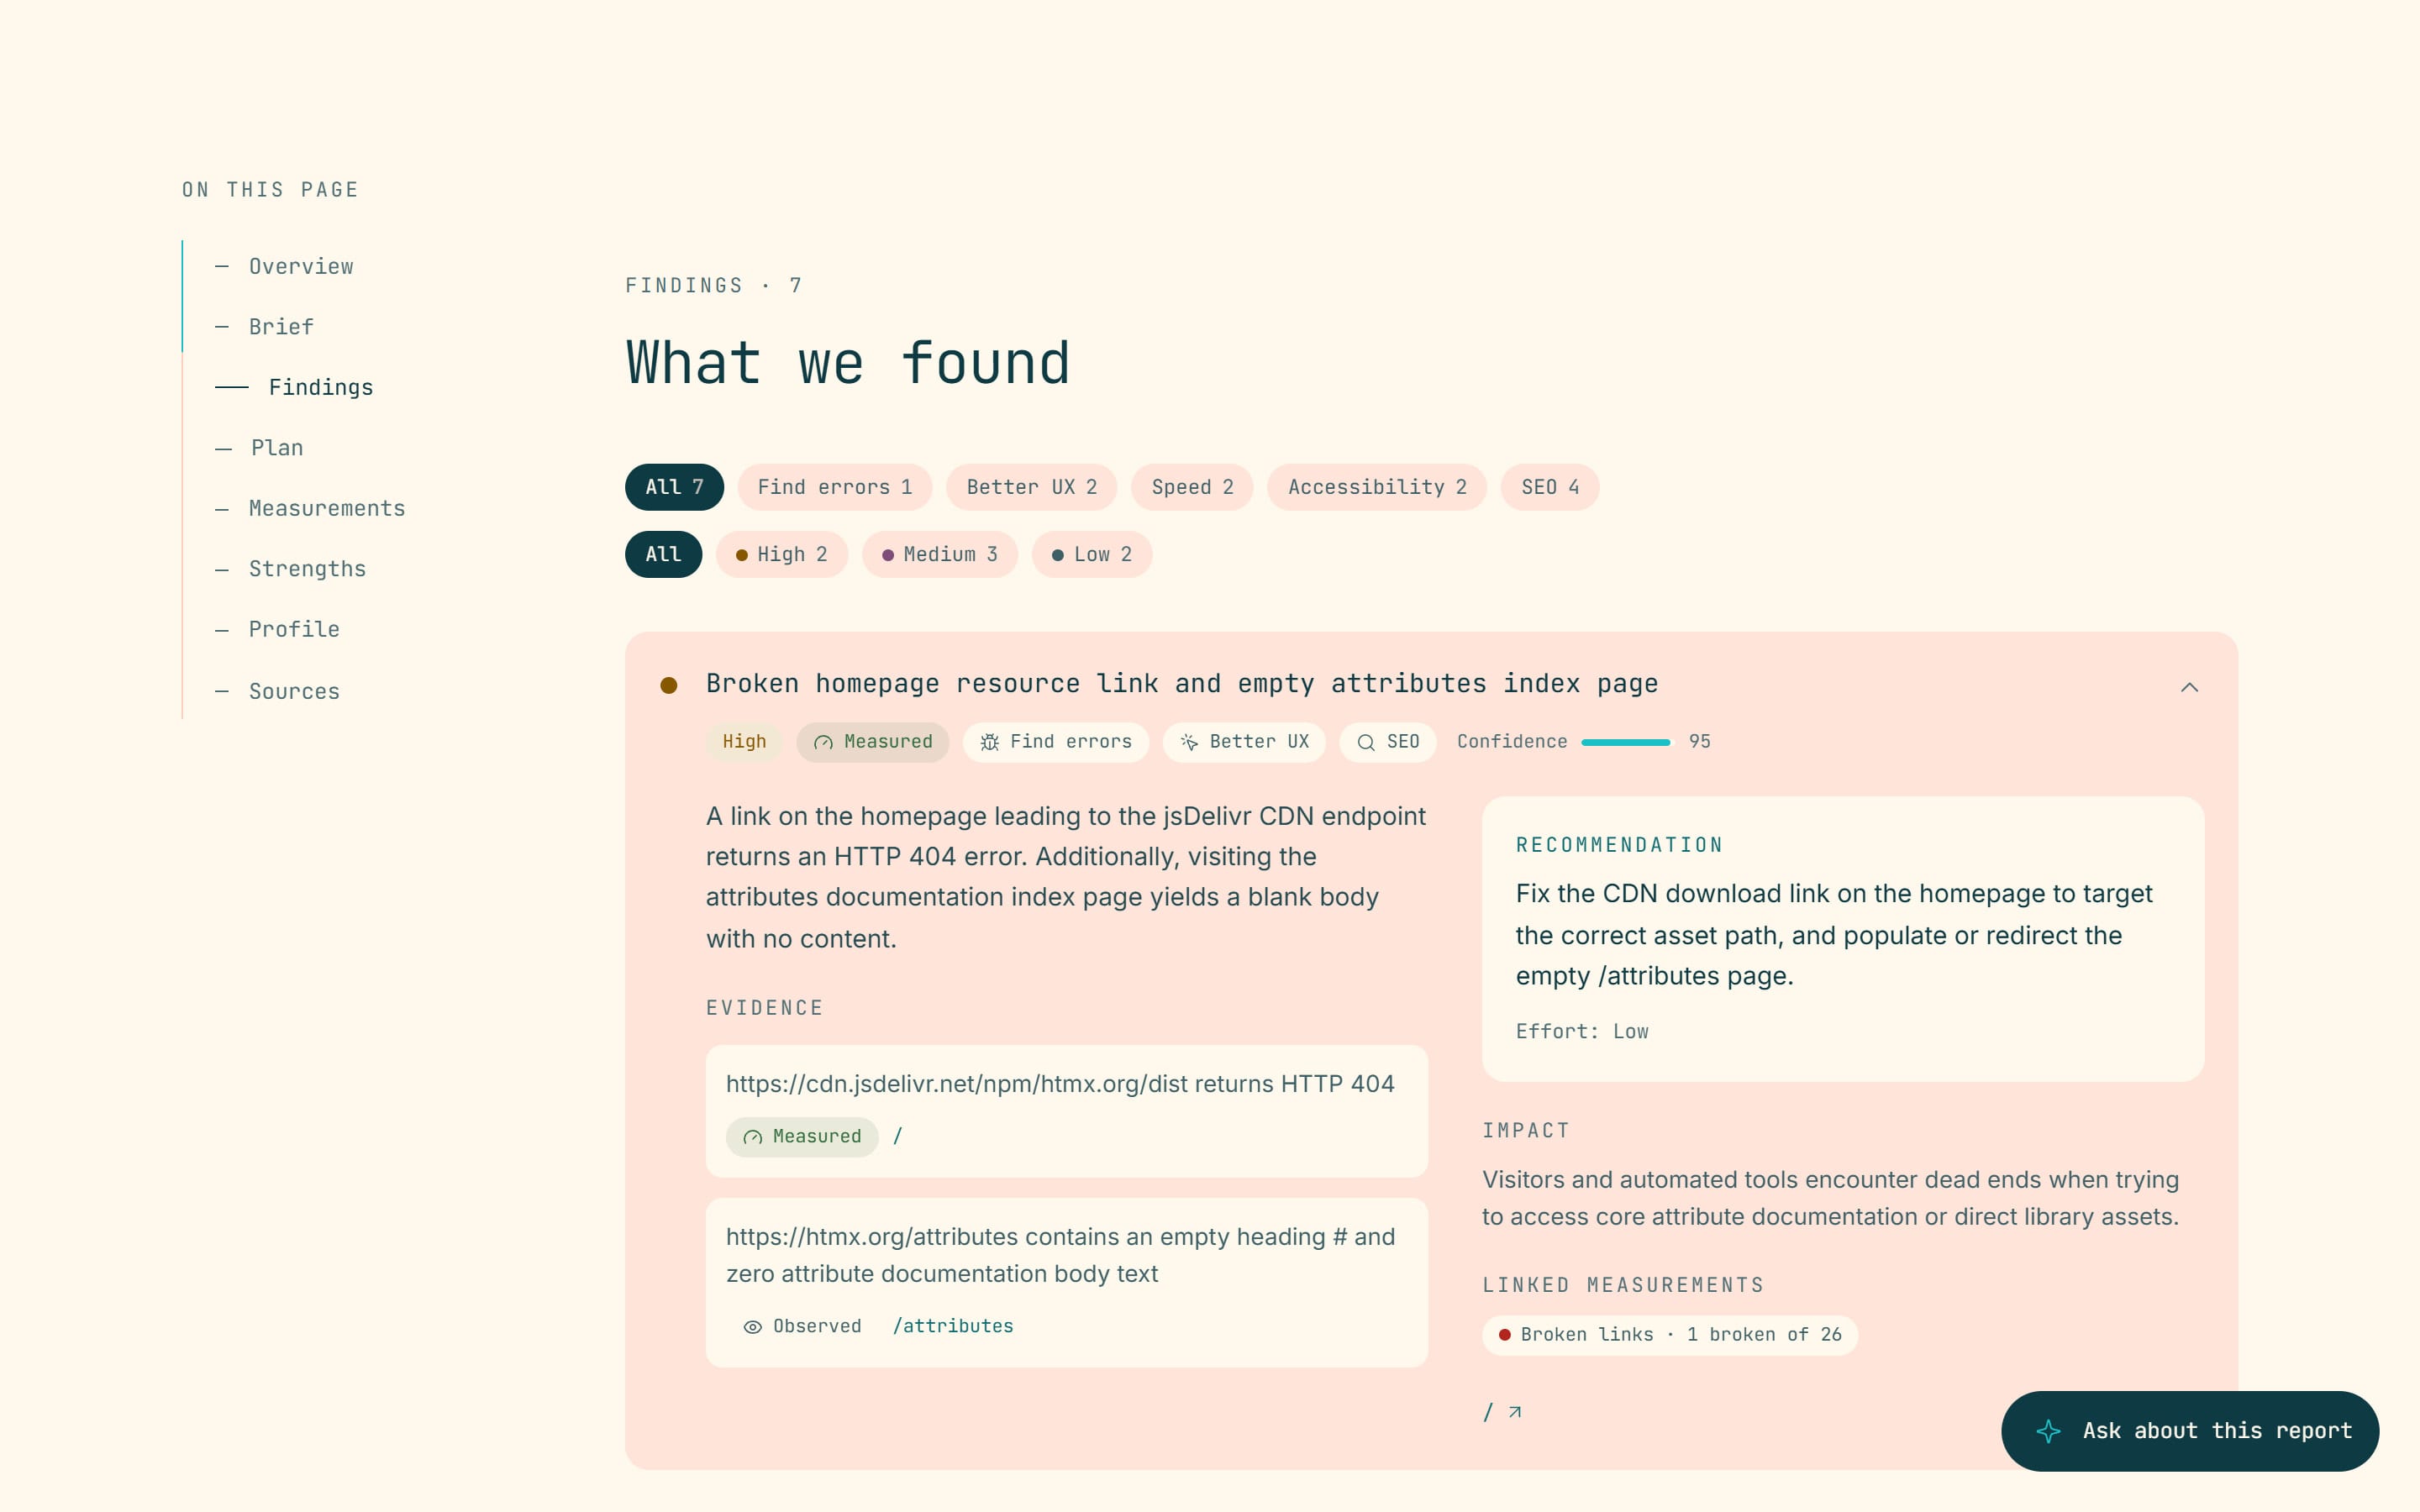
I tested the tool on real sites, in both modes and both languages. One test revealed a false finding: the AI said some documentation was « truncated », when it was the tool cutting long pages. That is fixed, and the same test confirmed a real problem: empty reference pages.
-
Step 5: Visual redesign and launch
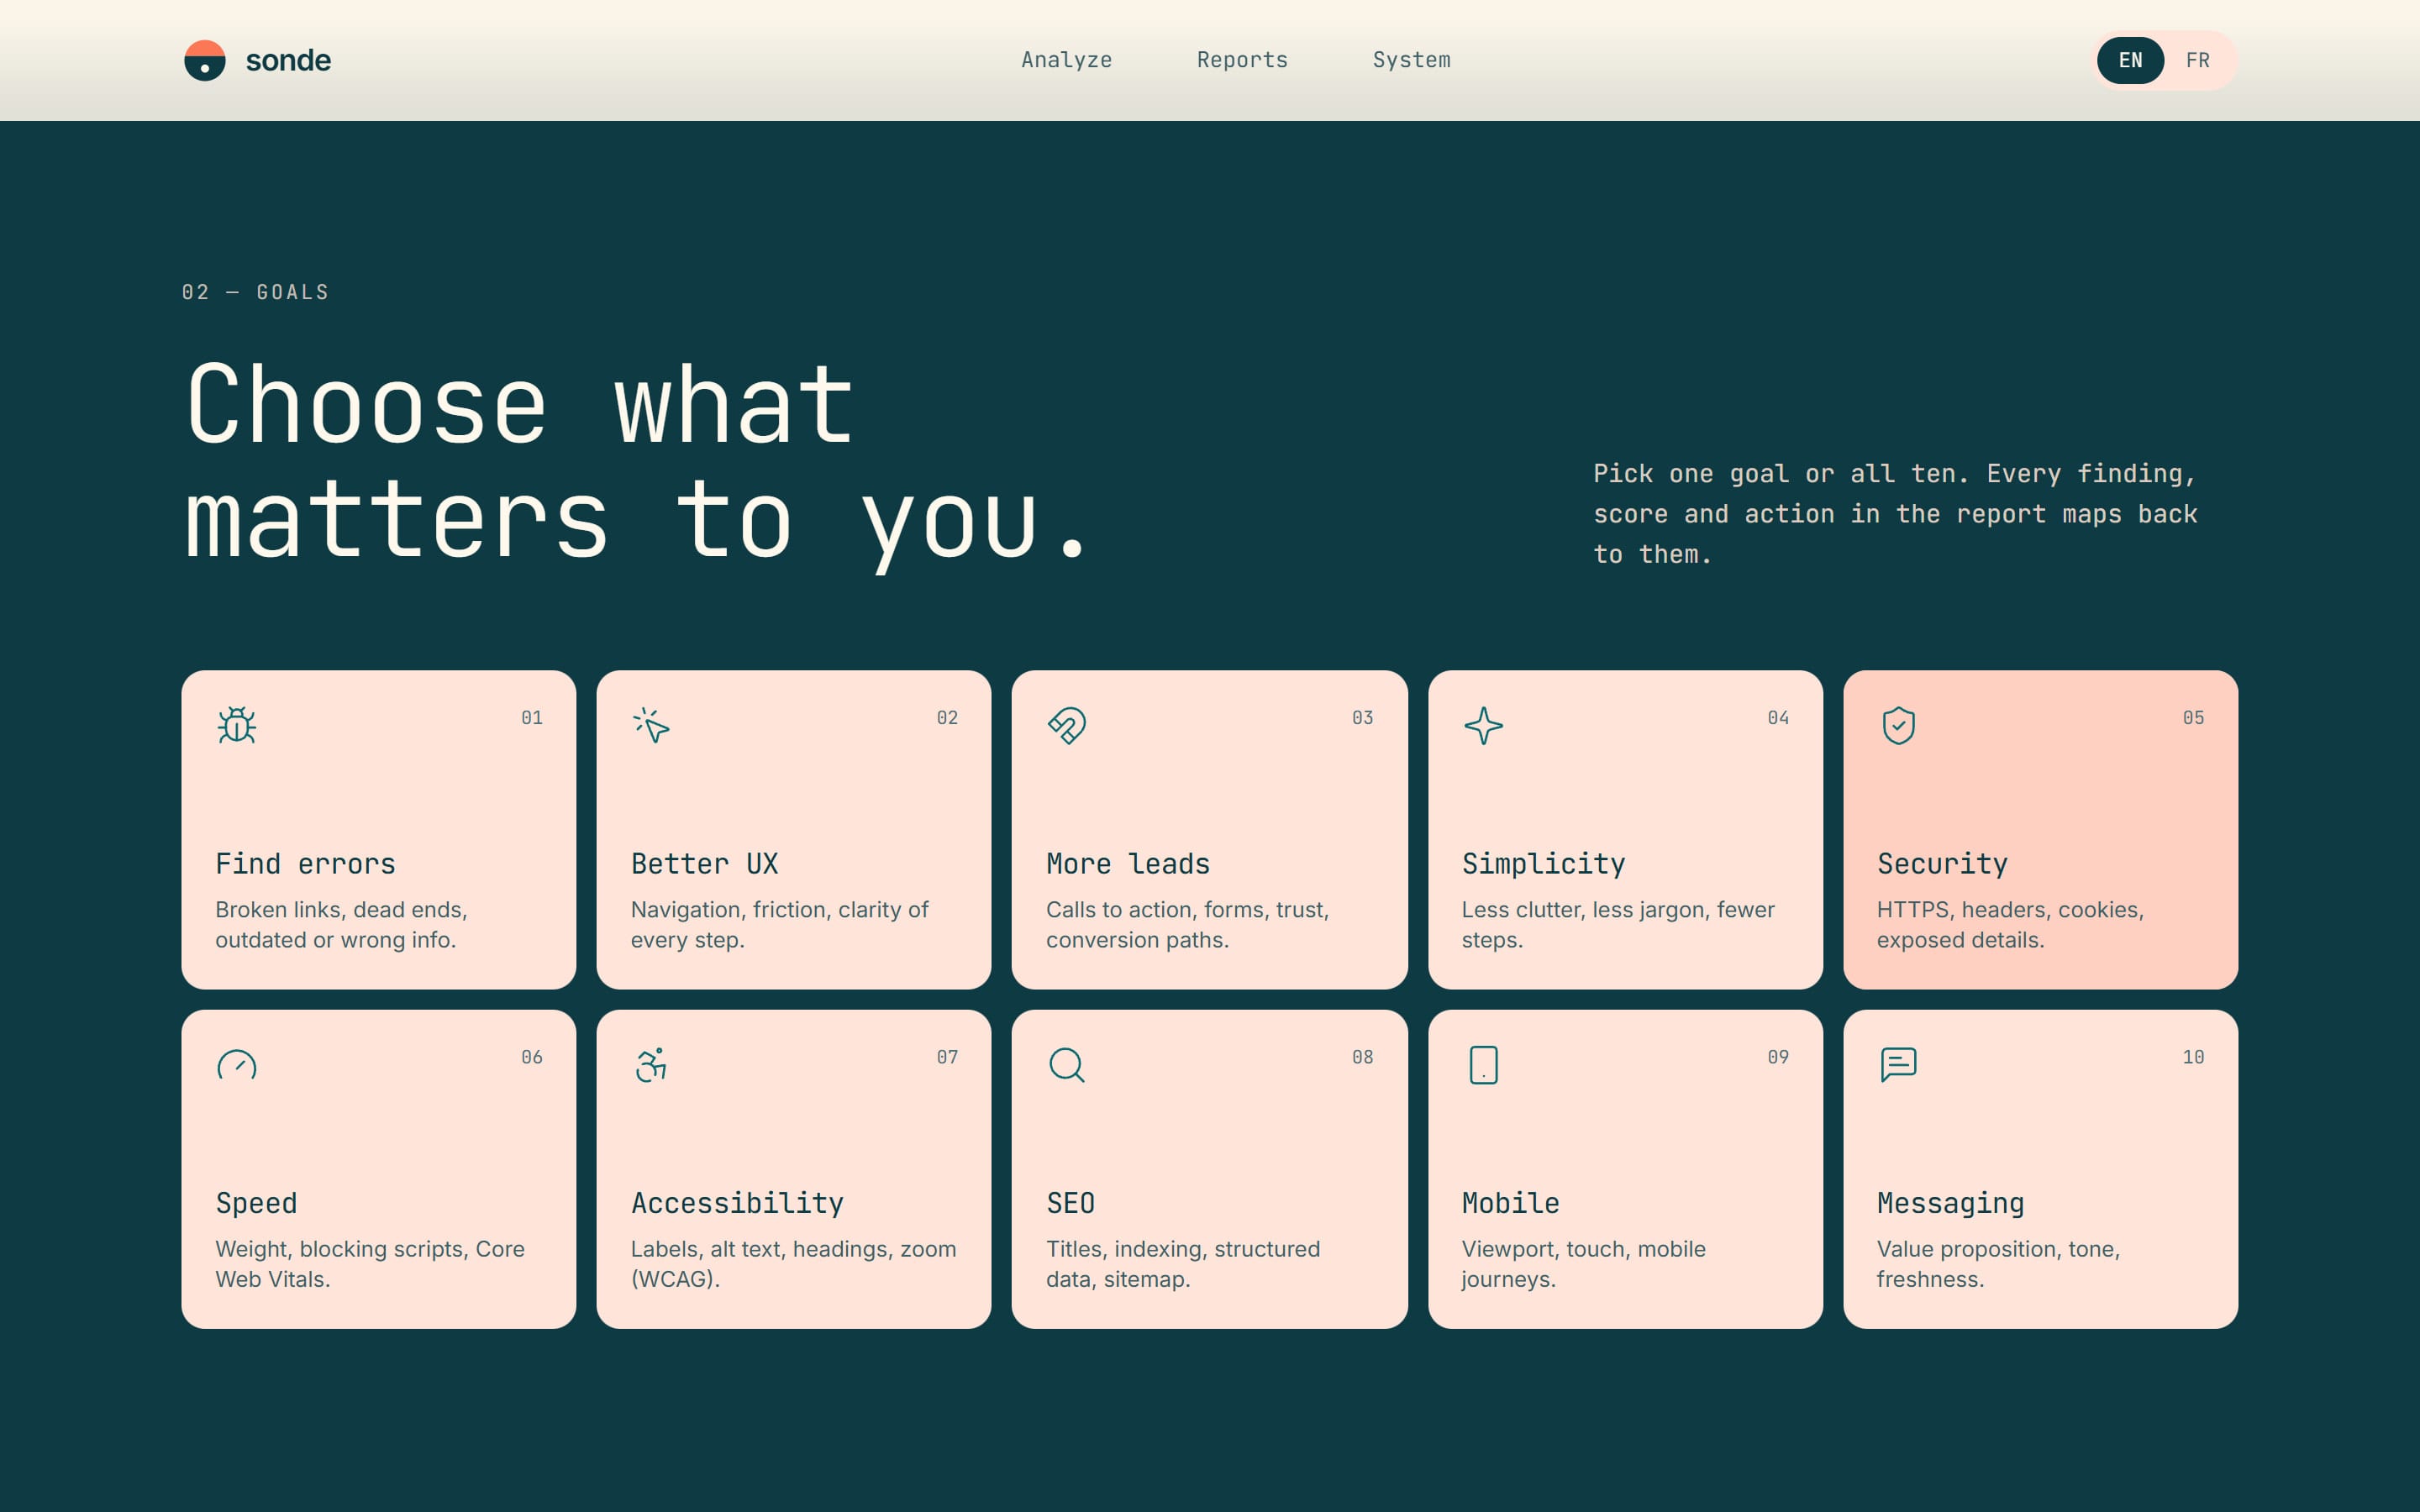
The first version looked too « AI-made »: outlines everywhere, a sonar logo and buttons that followed the cursor. I redid it with solid surfaces, a new logo, a single hover effect and a palette drawn from a reference image (coral, salmon, marigold, lemon and turquoise). The tool is online on Firebase.
Technologies
-
Programming, testing, debugging and deployment were done with the Claude Code agent, from my instructions.
-
Reads the pages, simulates a visitor’s journey, writes the findings and the plan, rereads every claim and answers questions about the report. The key stays on the server, in Secret Manager.
-
Firebase Hosting for the app and Cloud Functions for the analysis, whose progress arrives live in the browser.
-
Interface built with React, TypeScript, Vite and Tailwind; the same zod schemas validate server and browser data.
-
The coloured smoke behind the home page title is a custom-written WebGL shader.
Challenges
An analysis report is only useful if you can trust it, yet AI can say false things about a site. The first design, for its part, looked AI-made.
Solutions
Measurements come before AI, every claim shows its source and a review pass rereads everything. If the AI does not respond, the tool still delivers a measurement report. For the design, I replaced the outlines with solid surfaces.
Final result
A web app online, in French and English: a quick analysis (about a minute) or an in-depth one (3 to 4 minutes), then a report with scores by goal, sourced findings, an action plan, a question assistant and PDF export.